Overload and fault risk forecasting
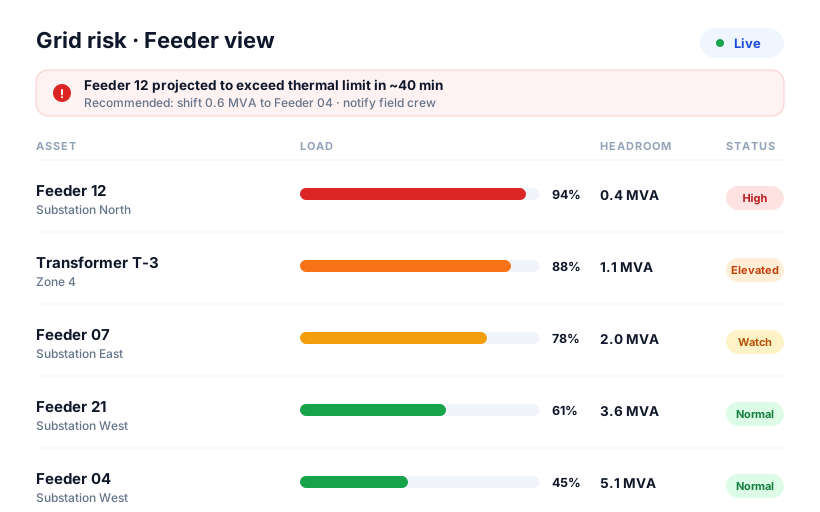
Detect probable feeder stress, transformer risk, and overload patterns before outages escalate.

Solutions | Grid Management
Vastvic Grid Management helps utility teams forecast overload risk, understand topology, map asset conditions, and simulate likely outcomes before disruptions spread across the network.
Core Capabilities
Detect probable feeder stress, transformer risk, and overload patterns before outages escalate.
Model how events propagate across connected assets and operational dependencies.
Map infrastructure conditions and test response strategies before field action is taken.
Operational Workflow
Track stress, load movement, and asset visibility across operating regions.
Test response strategies before committing field crews and interventions.
Understand how distributed generation changes grid behavior and local risk.
Use live signals and topology context to prioritize the next action.
$ vastvic grid simulate --network west-distribution
Feeder stress probability increased at three substations
Transformer overload pattern linked to rooftop solar volatility
Graph propagation model updated downstream risk estimates
Mitigation options ranked by impact and response time
Grid action summary sent to operations lead

Where It Fits
Track the probability of overload and stress before the issue becomes customer-facing.
Combine asset mapping, rooftop solar visibility, and local context in one layer.
Model likely future states so teams can choose better mitigation paths.
Use risk ranking and impact visibility to focus limited field capacity.

Use the sales chat in the bottom-right corner or book a demo to discuss your network use case.
“Vastvic gave us a day-ahead view of our solar output without hiring a data team.”